 Abstract
 Introduction
 Algorithms
 Results
 Conclusions
 References
 Other formats
 Abstract
 Introduction
 Algorithms
 Results
 Conclusions
 References
 Other formats
Abstract
Image processing has long been an important aspect of the computer science world and flaw repairing is one of its crucial components. Flaw repairing is the removal of part of an image and the restoration of a smoothly interpolated subimage. This may be used to remove a blemish on your face (or to airbrush yourself out of the picture on the desk of once-your-foe-now-your-boss, like George Costanza). The question is how to accomplish it efficiently. The conventional way has been to manually fill the pixels in the flaw with color levels in the vicinity. A more efficient solution has been proposed by Tetsuo Asano. His method exploits algorithmic techniques from computational geometry, which uses the alternative contour representation of a graph.
Traditionally graphs have been represented as digital matrices, with each entry representing a pixel value. Throughout this paper, color images will be treated as three monochromatic images, depending on the intensity of the red, green and blue components. The intensity of a pixel is indicated by an integer i, in the range 0 to 255. Since the image is treated as being monochrome, these are called gray levels. An alternative representation is based on the use of contour lines. For each gray level i we compute connected regions of pixels with gray levels greater than or equal to i. Representation of an image as a collection of those boundary lines associated with gray levels (contour lines) is the contour representation of an image [1].
We first give an efficient algorithm for computing contour lines for each gray level. Then we discuss how to accomplish flaw repairing using this information.
Introduction
Let G = g[i][j] i = 1...h-2, j = 1...w-2 be an image such that each g[i][j] is an integer between 0 and L-1. For convenience we embed the image into a two-dimensional h × w array so that the boundary elements are all –1. A one-dimensional array p[k], k = 0...wh-1 representing the pixels is mapped to the matrix, k = i×w + j.
The horizontal edge below a pixel p[k] and vertical edge to the right of p[k] are used to represent the pixel and numbered as 2k and 2k+1, respectively. All edges are sequentially numbered, ei, i = 0...2wh –1. Each edge is directed so that the interior of a region lies to its right. North and East are labeled positive while South and West as negative.
The set of connected pixels with gray levels greater than or equal to i, 0 <= i <= L-1, makes up the region Ri. By the definition, Ri+1 Í Ri for every i. Each connected region may have multiple boundary components because of holes.
Contour[i], 0 <= i <= L-1, is the set of edges whose corresponding pixels have gray levels greater than or equal to i. The flaw region is a rectangular area within the image.
We have implemented a program to peform flaw repair in C++ and made experiments on four images, which will be described later. Inputs to the program include a raw ppm format image file and the coordinates of the four corners of the flaw region to be restored. Three matrices representing the red, green and blue level values of the pixels are constructed from the image file and used as the primitive image information throughout the program. The output consists of the new image in raw ppm format.
First, we will present an algorithm to construct the contours. Then contour lines inside the flaw region are removed and thus result in the disconnection of some contours. The question is how to connect the disconnected contours, ie, the edges intersecting the boundary of the flaw region, in a natural way. We apply dynamic programming to find the minimum total length to interconnect these edges and then fill the flaw with new contour lines. Finally, a new image is constructed from these contour lines, and output as the final result.
Algorithms
Construct the Contours
Lemma: Let ei be an edge between two adjacent pixels p and q with gray levels g[p] and g[q], respectively. Then, the edge is included in the boundaries of the regions Rmin(g[p], g[q])+1... Rmax(g[p], g[q]) if g[p] ¹ g[q].
As the first step we perform a raster scan to detect edges. For an edge ei between gray levels g1 and g2 with g1 < g2, we add edge ei to the list contour[i] where the direction of the edge is determined so that the pixel of greater gray level lies to the right of the directed edge. After the raster scan over the whole image, the list contour[0] consists of all edges on the boundary of the region R0, which in this case all together forms a rectangle enclosing the original image.

| Original Matrix | Contour for Level 0 | Contour for Level 2 | Contour for Level 3 |
Calculate Intersections
For each two adjacent pixels p and q along the boundary of the flaw, if g[p] ¹ g[q], then edges with level min (g[p], g[q])+1...max(g[p], g[q]) must be included in the list of intersecting edges. The number of incoming edges must be equal to the number of outgoing and hence the total number of intersections must be even.
DP Formulation
An algorithm for flaw repairing is as follows: Let (v1, v2...vn) be a sequence of terminals on the boundary of the flaw. If vi and vj have different directions (incoming/outgoing) and the same gray level, d(i, j) is defined to be the Euclidean distance between vi and vj. Otherwise, d(i, j) is defined to be +INFINITY. t(i, j) is defined to be the minimum among sums of lengths of legal paths interconnecting vi, vi+1...vj which satisfy the conditions stated above. If there is no legal interconnecting pattern then t(i, j) is +INFINITY. The goal is to find t(1, n).
t(i, j) = 0 if j <= i.
t(i, j) = min i+1<=k<=j ( d (i, k) + t(i+1, k-1) + t(k+1, j) ) if j > i and both k-i and j-i are even.
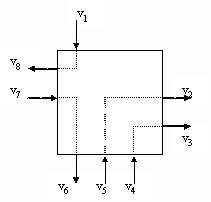
Figure 2: DP formulation.
Bresenham's Algorithm
To connect two edges, we apply Bresenham's line algorithm.
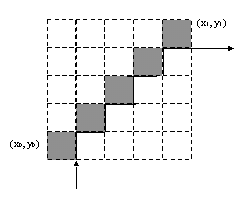
Figure 3: Bresenham's algorithm.
void BresenhamLine (
    int x0, int y0,                // Left endpoint
    int x1, int y1,                // Right endpoint
    int value)                     // Value to place in line's pixels
{
    int x;                         // x runs from x0 to x1
    double dy = y1 - y0;
    double dx = x1 - x0;
    double m = dy / dx;
    // We assume that -1 <= m <= 1, x0 < x1.
    // The other cases are handled by variants of this algorithm.
    double y = y0;
    for (x=x0; x<=x1; x++) {
        WritePixel (x, Round(y), Value);
        y += m;                    // Step y by slope m
    }
}
We assume that the line's slope is between –1 and 1. Other slopes can be handled by suitable reflections about the principal axes [3].
This is a standard line drawing algorithm used in computer graphics. We have modified the algorithm to draw a line along the cracks between pixels, rather than through the pixels themselves.
Back to Matrix
How can we use the new contour lines inside the flaw to determine the pixel values? A pixel p[k] may be enclosed in several regions and its adjacent edges included in several contours of different levels. To decide what value the pixel should have, we examine the edges it is associated with. If p[k] has positive edges ei...ej to its right or beneath it, p[k] = min (levels of ei...ej) –1. If p[k] has negative edges ei...ej, p[k] = max (levels of ei...ej).
However, a pixel may not have any adjacent edges that are on the boundary of some contour. Within the flaw, we then propagate the pixel values as determined from above to its undetermined neighbors.
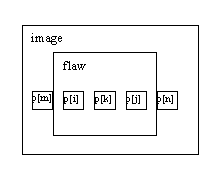
Lemma: Initialize all p[] within the flaw to be +INFINITY. Let p[k] be a pixel with unknown value in the flaw region. If p[k] has right and left neighbors p[i] and p[j], respectively, (not necessarily adjacent) and both values have been determined, p[k] = min (p[i], p[j]). If no such p[i] exists, let p[m] be the pixel just outside the left boundary and on the same row as p[k], p[k] = p[m]. If no such p[j] exists, let p[n] be the pixel just outside the right boundary and on the same row as p[k], p[k] = p[n].
Results
The total running time is bounded by the dynamic programming calculation, or q (n3), with n being the total number of intersections.
Flaw repairing is trivial if the vicinity of the flaw region has no variation in colors. The total number of intersections will be zero and all pixels within the flaw will be given the value of pixels outside the boundary. The result appears seamless.

|

|
|
|
|
However, if the flaw region lies on top of a textured surface, with subtle variations in colors, the result is not always optimal. After computing the shortest total cost of interconnecting all the incoming/outgoing edges, original texture may not be preserved in the new image (see Figure 7 and 8).

|

|
|
|
|

|

|
|
|
|

|

|
|
|
|
Conclusions and Future Study
Limitations of the program include the restrictions on the input format and not working satisfactorily on all types of images as shown above. Further work can be done to accept arbitrarily shaped flaw region as input and to enhance the results by finding a better total cost function in the dynamic programming calculation. However, all flaw regions can be subdivided into rectangles and the rules of this program still apply.
References
[1] T. Asano and S. Kimura, "Contour Representation of an Image with Applications" in Vision Geometry IV, R. A. Melter, A.Y. Wu, F. L. Bookstein, W.D.K. Green, Editors, Proceedings of SPIE 2573, 14-22 (1995).
Other Formats


